Last year, Jase Richardson made his first start as a Spartan in the 23rd game of the season against Oregon. Richardson scored a career high of 29 points that day as MSU had a huge second half and came back to beat the Ducks at home.
This year, Jordan Scott also got his first start in the 23rd game of the season. This was at Minnesota and Scott registered a career high of 15 points. Unfortunately, however, the Spartans endured one of their worst outings of the season and fell to the Gophers.
Join the conversation!
Sign up for a user account and get:
- Improved notifications system!
- Fewer ads
- Create community posts
- Comment on articles, community posts
- Rec comments, community posts
Even though the outcome was different in each player’s starting debut, Michigan State was mired in a slump the last two years when they changed up the rotation. Last year, MSU had just returned from Los Angeles with consecutive losses to USC and UCLA when they made the switch to Jase. They returned home and had the comeback against Oregon but then fell again to Indiana to complete a 1-3 stretch. The 2025 Spartans wouldn’t lose again until the Big Ten Tournament semi-finals against Wisconsin before advancing to the Elite 8 in the NCAA Tournament.
This year, in the two games prior to the switch to Scott, MSU escaped with an overtime win at Rutgers and then lost at home to Michigan. Scott’s first start was the dreadful Minnesota loss but the Spartans rebounded to defeat Illinois in overtime. That was followed by another clunker at Wisconsin.
So, both Richardson and Scott made their starting debuts amidst a 1-3 stretch of struggling play for MSU. Fortunately the 2025 Spartans’ difficulties ended with the Indiana loss and they went on to a regular season conference championship. Repeating that feat is all but impossible for this year’s MSU team in a much deeper Big Ten and it remains to be seen if they can work their way out their latest February swoon and get back to being the team that looked so formidable earlier in the season.
While there are some similarities between the circumstances of the lineup changes the past two years, there are also some important differences. Last year, Jase was consistently playing 20-25 minutes a game off the bench. He failed to play at least 20 minutes just twice in MSU’s first 22 games (excluding the Maui Invitational game against North Carolina when he was out due to concussion protocol) and played as many as 25 minutes several times.
This year, Jordan had generally been in the 15-20 minute range prior to assuming a starting role but his minutes have fluctuated more than Richardson’s. Scott played 26 minutes in the second game of the year against Arkansas and matched that later in the loss to Duke. However, he only played two minutes in a win against North Carolina and nine in the win at Oregon. Other than that, he’s had several outings in the 12-18 minute range but went 26 minutes in his last two games off the bench against Rutgers and Michigan.
Given some of the similarities, we thought it might be interesting to take a numerical look at how 2026 Jordan Scott compares to 2025 Jase Richardson. We looked at common statistics like minutes, points, rebounds, assists, and turnovers per game but also normalized these to a per-40 minute basis. We also looked at field goal percentage, three point field goal percentage, and three point shooting. Finally we looked at plus/minus and Evan Miya’s Bayesian Performance Rating.
Let’s get to the numbers!
Comparing Jase and Jordan when coming off the bench:
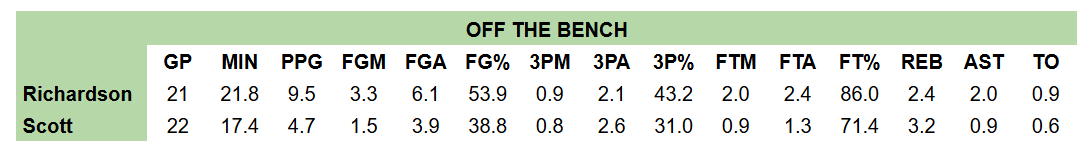
Prior to taking over their starting roles, Richardson played more minutes and was the more productive player in terms of shooting and scoring ability. The taller Scott is the better rebounder.
This still holds true when points, rebounds, assists, and turnovers are normalized to 40 minutes:

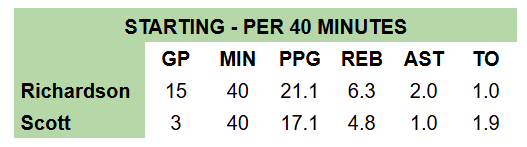
Although it’s so far a very small sample size for Scott, the comparison gets a little closer when games in which the two players have started are compared:
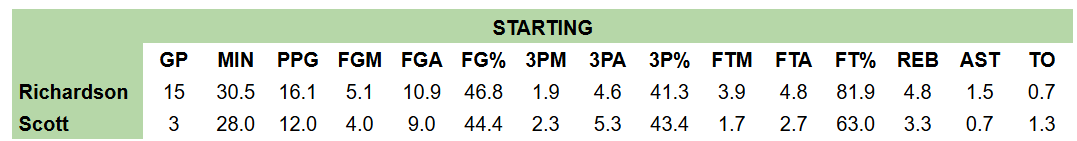
The shooting percentages are much closer and Scott, so far, is actually the better three point shooter but Richardson was far superior from the free throw line. Interestingly, Jordan’s rebounding numbers have dipped a bit in his first few games as a starter.
The per 40 minutes comparison might not mean as much here because Richardson averaged 30.5 minutes per game as a starter and Scott is, so far, right behind him at 28.
Even though Scott’s production, in terms of these statistics, doesn’t compare to Richardson’s when they were coming off the bench, things get closer when their starting experience is compared. Again, the sample size for Scott is still very small but it could be encouraging for MSU going forward, especially if Jordan can get his rebounding mojo back and cut down his turnovers.
These graphs hopefully display the above number more visually:

Let’s look at a couple of other statistics, starting with plus/minus, which is simply the number of points scored for the player’s team with him on the court, minus the number of points scored by the opponent with him on the court.
Last year, Richardson finished the year at plus 271. This was third on the team behind Jaden Akins (+319) and Jaxon Kohler (+281). If you normalize per game, with Richardson playing in 36 of the Spartans’ 37 games last year, Richardson averaged +7.53 per game for MSU last year. Throughout his 36 games last year, Richardson averaged 25.4 minutes per game. So, on a per 40 minute basis, he would have been +11.9 last year.
This year, Scott is plus 141 through the Wisconsin game. This is behind Kohler (+274), Jeremy Fears (+269), Coen Carr (+217), Kur Teng (+210), and Carson Cooper (+173). Scott’s +141 is equal to +5.64 per game so far. Through MSU’s first 25 games, Scott is averaging 18.4 minutes per game. On a per 40 minute basis he is +12.3; slightly better than Richardson’s +11.9.
The overall plus/minus figures above (271 for Richardson last year and 141 for Scott so far this year) come from Evan Miya’s website evanmiya.com.
Finally, let’s look at one more statistic that Miya provides – the Bayesian Performance Rating, or BPR. According to Miya, the BPR rating is the ultimate measure of a player’s overall value to his team when he is on the floor. BPR is interpreted as the number of points per 100 possessions better than the opponent the player’s team is expected to be if the player were on the court with 9 other average players. A higher rating is better.
BPR is the sum of a player’s Offensive Bayesian Performance Rating (OBPR) and Defensive Bayesian Performance Rating (DPBR), which Miya defines below. OBPR and DBPR reflect the offensive and defensive values a player brings to the team when he is on the court.
OBPR is interpreted as the number of offensive points per 100 possessions above D1 average expected by the player’s team if the player were on the court with 9 other average players. DBPR is interpreted as the number of defensive points per 100 possessions better than (below) D1 average expected to be allowed by the player’s team if the player were on the court with 9 other average players. These ratings incorporate a player’s individual efficiency stats and on-court play-by-play impact, and also accounts for the offensive/defensive strength of other teammates on the floor with him, along with the defensive/offensive strength of the opponent’s players on the floor.
Richardson’s BPR led the team last year at 7.70. Fears was second at 6.65. This year, Scott is currently fifth on the team with a 4.46 BPR. This is behind Fears (10.95), Kohler (7.10), Carr (5.45), and Cooper (5.28).
It’s unrelated to this article, but that’s certainly a massive jump for Fears, whose BPR ranks 4th in the nation at the time of this writing behind Cameron Boozer (Duke) at 13.65, Yaxel Lendeborg (Michigan) at 12.96, and Braden Smith (Purdue) at 11.48.
Perhaps the bottom line, as it relates to the Richardson-Scott comparison, is that the numbers suggest that while Jase was the more productive player coming off the bench, the two players appear to be more similar in a starting role. At least through Scott’s first three starts. Although he may not yet look like MSU’s next one-and-done freshman, he’s definitely taken advantage of the chance to start to improve his scoring productivity. Hopefully he can continue to improve and help the Spartans out of their, what seems to be an annual, February slump.